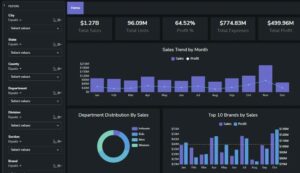
Business intelligence (BI) tools have become increasingly important in the modern business world, as companies seek to leverage data to make informed decisions. With so many BI tools available, it can be difficult to determine which ones are the most effective for your business needs. In this article, we will explore the top 10 business intelligence tools that are expected to make waves in 2023.

Table of Contents
- Introduction
- Criteria for Evaluating BI Tools
- Power BI
- Tableau
- Looker
- QlikView
- IBM Cognos Analytics
- SAP BusinessObjects
- MicroStrategy
- TIBCO Spotfire
- Domo
- Conclusion
- FAQs
1. Introduction
Business intelligence tools are used by companies to analyze data in order to make informed decisions. These tools allow users to extract insights from large data sets, and visualize data in a way that is easy to understand. With so many BI tools available in the market, it can be difficult to determine which one is the best fit for your business needs. In this article, we will explore the top 10 business intelligence tools that are expected to make waves in 2023.
2. Criteria for Evaluating BI Tools
Before diving into the top 10 BI tools, it is important to understand the criteria used to evaluate them. The following are some of the key factors to consider:
- Ease of use
- Data visualization capabilities
- Integration with other systems
- Scalability
- Security
- Customer support
With these factors in mind, let’s explore the top 10 BI tools.
3. Power BI
Power BI is a Microsoft tool that allows users to connect to various data sources, and create interactive reports and dashboards. With Power BI, users can easily visualize data and gain insights into their business performance. One of the key benefits of Power BI is its integration with other Microsoft tools such as Excel and SharePoint.
4. Tableau
Tableau is a popular data visualization tool that allows users to create interactive dashboards, reports, and charts. With Tableau, users can easily connect to various data sources, and visualize data in a way that is easy to understand. Tableau also offers a variety of advanced features such as predictive analytics and data blending.
5. Looker
Looker is a data analytics tool that allows users to create and share reports, dashboards, and visualizations. Looker’s key features include the ability to easily explore data, drill down into details, and collaborate with other team members.
6. QlikView
QlikView is a BI tool that allows users to easily create interactive reports and dashboards. With QlikView, users can easily visualize data, and gain insights into their business performance. QlikView also offers a variety of advanced features such as predictive analytics and data blending.
7. IBM Cognos Analytics
IBM Cognos Analytics is a BI tool that allows users to easily create and share reports, dashboards, and visualizations. With IBM Cognos Analytics, users can easily connect to various data sources, and gain insights into their business performance. IBM Cognos Analytics also offers a variety of advanced features such as predictive analytics and data blending.
8. SAP BusinessObjects
SAP BusinessObjects is a BI tool that allows users to easily create interactive reports and dashboards. With SAP BusinessObjects, users can easily connect to various data sources, and gain insights into their business performance. SAP BusinessObjects also offers a variety of advanced features such as predictive analytics and data blending.