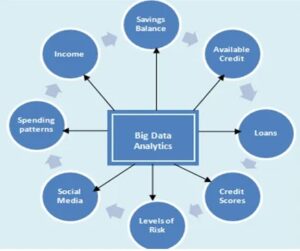
In today’s digital age, businesses generate vast amounts of data every day. This data can be used to gain insights into customer behavior, market trends, and internal operations. However, the sheer volume of data can be overwhelming, making it challenging to extract meaningful insights. This is where business intelligence (BI) comes into play. In this article, we will explore what business intelligence is, how it can help businesses make sense of big data, and the different tools and techniques used for BI.

What is Business Intelligence (BI)?
Business intelligence refers to the process of collecting, analyzing, and presenting data to help businesses make informed decisions. BI involves using data mining, data analysis, and data visualization tools to extract insights from large datasets. The primary goal of BI is to provide decision-makers with accurate and actionable information that can help them optimize business processes, identify new opportunities, and make informed decisions.
Why is BI Important for Businesses?
Business intelligence plays a crucial role in helping businesses make sense of big data. In today’s fast-paced business environment, companies that can make informed decisions quickly have a significant advantage over their competitors. BI helps businesses do just that by providing real-time insights into key business metrics.
By leveraging BI tools, businesses can gain a better understanding of customer behavior, market trends, and internal operations. This information can be used to optimize business processes, improve customer satisfaction, and identify new growth opportunities. Ultimately, BI enables businesses to make data-driven decisions that lead to better outcomes.
Techniques Used for BI
Business intelligence involves a range of techniques and tools. Here are some of the most commonly used techniques for BI:
Data Warehousing
Data warehousing involves collecting and storing data from multiple sources in a central repository. This allows businesses to access all their data in one place and makes it easier to analyze and extract insights.
Data Mining
Data mining is the process of analyzing large datasets to discover patterns, correlations, and trends. This technique uses statistical algorithms and machine learning models to identify relationships between different variables.
Data Visualization
Data visualization involves presenting data in a graphical format, such as charts, graphs, and maps. This technique helps businesses quickly identify patterns and trends in their data and communicate insights effectively.
Dashboards
Dashboards are a type of data visualization that provides a real-time overview of key business metrics. This technique enables decision-makers to monitor performance and identify trends and anomalies quickly.
BI Tools
There are several BI tools available in the market. Here are some of the most popular ones:
Tableau
Tableau is a data visualization tool that enables businesses to create interactive dashboards and reports. It supports a wide range of data sources and allows users to create custom visualizations.
Power BI
Power BI is a business analytics tool that allows businesses to create interactive reports and dashboards. It integrates with other Microsoft products, making it a popular choice for businesses that use Microsoft software.
QlikView
QlikView is a business intelligence platform that allows businesses to create interactive dashboards and reports. It uses in-memory technology to deliver fast and responsive analytics.
Conclusion
In conclusion, business intelligence plays a crucial role in helping businesses make sense of big data. By leveraging BI tools and techniques, businesses can gain valuable insights into customer behavior, market trends, and internal operations. This information can be used to optimize business processes, improve customer satisfaction, and identify new growth opportunities. Ultimately, BI enables businesses to make data-driven decisions that lead to better outcomes.
FAQs
- What is the difference between business intelligence and big data? Business intelligence is the process of collecting, analyzing, and presenting data to help businesses make informed decisions. Big data refers to the massive amounts of data generated by businesses every day.
- What are some common BI techniques? Some common BI techniques include data warehousing, data mining, data visualization, and dashboards.
- How can BI help businesses improve customer satisfaction? By analyzing customer data, businesses can identify patterns in customer behavior and preferences. This information can be used to improve customer experience and create targeted marketing campaigns that resonate with customers.
- What are some challenges associated with implementing BI? Some challenges include data quality issues, difficulty integrating data from multiple sources, and ensuring that decision-makers have access to the right information at the right time.
- How can businesses ensure the success of their BI initiatives? Businesses can ensure the success of their BI initiatives by investing in the right tools and technologies, hiring skilled analysts and data scientists, and fostering a culture that values data-driven decision making. It is also essential to regularly monitor and evaluate the effectiveness of BI initiatives and make adjustments as needed.